Show Me the Money: How Your Learning Program Data Can Do Just That
BenchPrep has empowered a dynamic range of learning organizations to serve the needs of over ten million learners. Throughout that work, one fact has remained clear: each learning journey is a complex process.
And each creates a lot of data, or what we view as the key to financial success. That’s why any learning platform provider should make it easy for teams to access learning program data and, well, learn about their learners.
From demographic information to details about which materials best attract and retain learners, being able to easily access raw data along with digestible reports and dashboards is crucial to a successful (and lucrative) learning program.
In this blog, we outline a path toward uncovering the financial benefits of your organization’s data.
Step #1: Highlight In-Course and Out-of-Course Behaviors
We’ve written (and spoken) before about how data can help you achieve business objectives, like increasing learner utilization of practice materials or driving top-line revenue through learning program enrollment growth.
But picture this: your objective is well-defined, and you’ve collected the data housed in your learning management system (LMS). Yet you still can’t see how that data helps you achieve your goal.
Luckily, the solution is straightforward: highlight how learners interact with your LMS to help build a bridge between your business objectives and the LMS data that supports them. For the best view, it’s useful to segment learner behaviors into two “buckets.”
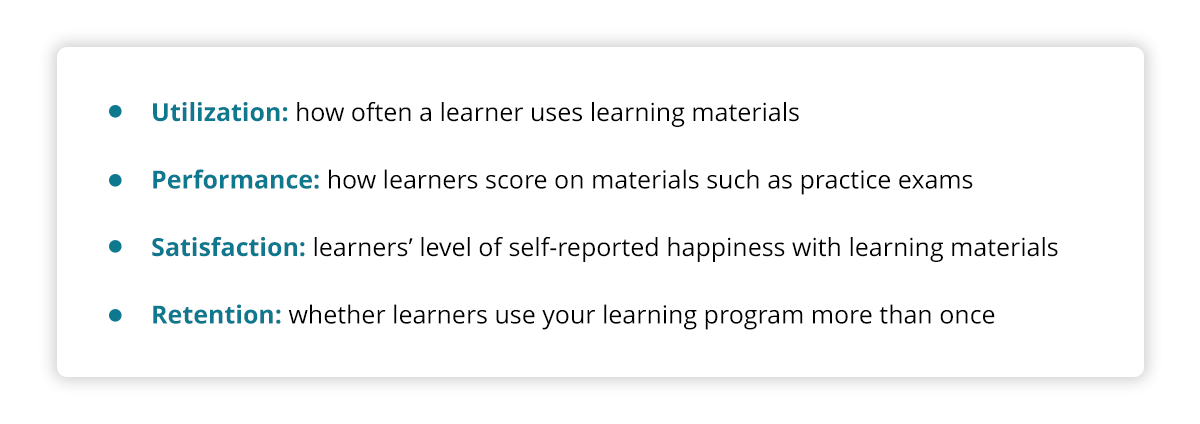
The first bucket, in-course behaviors, or actions occurring as a learner is actively learning, includes learner data such as: The second bucket, out-of-course behaviors, contains data generated before or after learners complete their learning. The data for these behaviors is often gathered outside your LMS and may be collaboratively managed with other stakeholders. Marketing interactions–say, which messages recruit the most learners into a program–are a good example of out-of-course behaviors.
Once you’ve bucketed your LMS data, you’re likely to notice just how much you have on hand. And that leads us to the next step toward turning that data into revenue: focus on only the information needed to achieve your goal.
Step #2: Focus On the Data that Supports Your Goals
Though all of an LMS’s data is useful for one objective or another, not all are necessary in every instance. That’s why identifying the behaviors most important to your specific revenue-driving plan allows you to focus on only the information that can help you achieve your goal.
That is: the right LMS empowers you to work with only the data that matters.
For example, what if you want to drive top-line revenue by increasing enrollment in your learning programs? In this case, you may decide it’s helpful to focus on three in-course behaviors:
- Utilization
- Retention
- Performance
So you dive in and gather data about the number of course enrollments and active learners along with the percentage of learners with a predefined completion rate (say, at least 50 percent). Then, you enrich this data with details about the number of notes taken during lessons, which lessons learners bookmarked most, and learning-specific survey data about learners’ levels of confidence.

Once you have the specific learner data that helps you focus on your goal, the next step is to identify patterns in the data to understand your learners and what motivates them. Then, you can offer a learning experience that attracts more learners to your program.
Step #3: Develop Data-Supported, Pattern-Based Solutions
The patterns you identify in your LMS data directly inform the actions you can take to further engage learners and, ultimately, increase revenue. Continuing to explore the example we began above, say the in-course data shows you that learning engagement starts off strong but decreases steadily. Worse, a low percentage of users ultimately complete their learning.
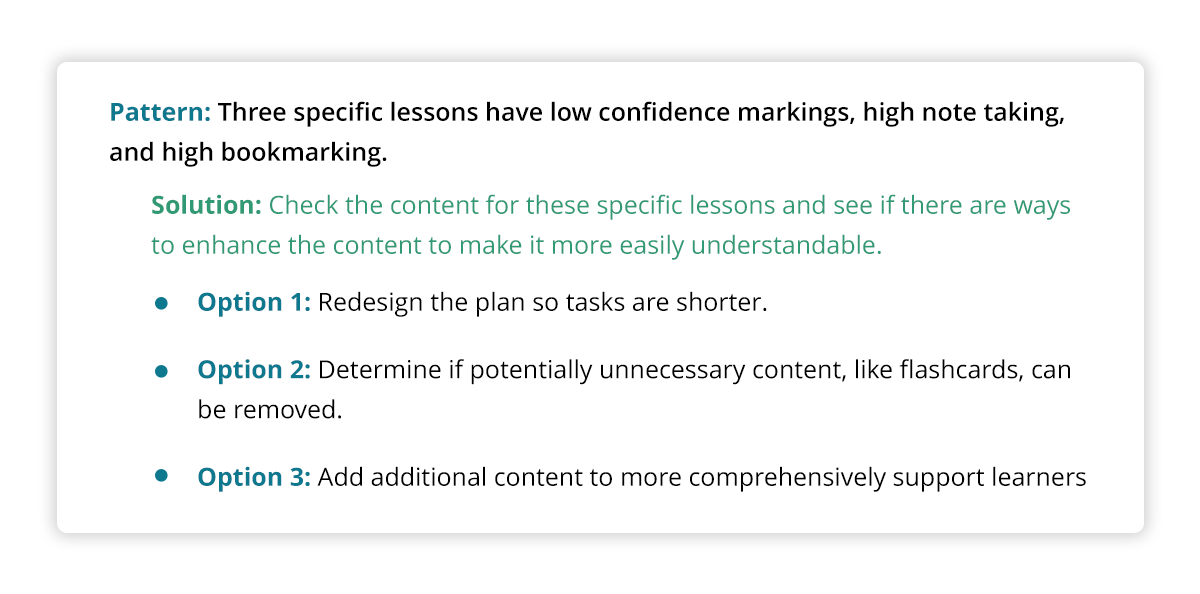
Look a bit closer at the data and you notice a correlation between practice exam performance and learning program completion: across three specific questions, learners report low confidence–even as they take more notes on these questions and bookmark them more often than other materials for continued study.
When viewed in tandem with learners’ self-reported confidence levels, the notes and bookmarks indicate materials that are difficult to learn rather than information that learners want to ensure they highlight.
What does this all uncover? It’s possible the practice materials are too dense, which makes it difficult for learners to fully absorb the information they need and, ultimately, frustrates and prevents them from completing their learning practice.
Let’s look at some actions you can take to address the pattern you identified: Developing learning materials that support learners and increase learner engagement is a practical way to turn LMS data into revenue. The easier learners find it to use learning materials, the more value they’re likely to find in them. This, in turn, leads learners to think more highly of your learning program and, ultimately, invest more in your organization.
Let Curiosity Guide Your Approach to Data-based Action
The right LMS makes it easy for organizations to develop materials that best support their learners. As you’ve seen throughout this blog, it’s a process powered by smart data management. So what’s the key to smart data management?
In a word: curiosity. As you take a more refined approach to working with your LMS data, you may find that it leads to as many new paths for your own learning as it does answers for how best to support your organization.
Interested in more about how BenchPrep supports data-based learning journeys? 


