-2.png)

Learning professionals are seeking creative ways to keep their business afloat, and, in order to do this, they’re taking a deep dive into their learning program data. But, data is just a collection of numbers, right? This is why many professionals are turning to the powerful tool of storytelling.
Storytelling unlocks the power within your learning business data, and, by knowing which questions to ask, can help bring your data to life.
In a recent webinar with The Learning Guild, BenchPrep’s Director of Business Strategy and Operations, Nish Ravichandran, shares 5 storytelling secrets you can use right now to propel your business forward. Here are the highlights from the webinar:
Secret #1: Start with “Why”
“If you don’t know where you’re going, any road will get you there” - Lewis Carrol. This fundamental truth applies not only in life but also in business. We can’t know we’re on the correct path of analysis unless we know where we’re headed.
But where do we start? How do we know what the right question is?
One way to begin is to start with the end in mind. What are your team’s core business objectives? Picture this: your program leader is sharing an update with the board and asked for more budget for the program. How would you make the business case that your program is successful and deserves additional budget?
Thinking through the potential answers to this question will help you articulate the key business objectives for your programs. Here are a few tips on business objectives:
- Collaborate with others to identify business objectives. It’s important that your entire team understand and supports these objectives.
- Becoming data-driven is a process of answering a series of questions, one at a time. We recommend starting with answering the biggest questions first. Not only do they build belief in an organization, but they are also the biggest bang for the buck.
Secret #2: Identify Learner Behaviors
After identifying what your business objectives are, you’re almost ready to jump right into the data. First, we need to understand and identify the learner’s behaviors.
Behaviors are the actions or sets of actions that data measures. Some learner behaviors can be as broad as usage, performance & satisfaction or as specific as studying flashcards, taking exams, and recommending products to friends.
It is critical to identify behaviors first because they force us to think about broad actions and find quantifiable examples of those actions in the data. A good way to understand and get data easier is by bucketing behaviors into two categories.
The first category to consider is in-learning behaviors or actions that take place when the end-user is actively learning. Take some time to think about the key actions that happen in your course. These can vary between studying lessons, to writing a course review. Group those actions into broader categories like:
- Utilization: How much does a learner use the course?
- Performance: How your learners are doing in the course?
- Satisfaction: Are they happy with their experience with your course?
- Retention: Are your learners coming back for more courses?
Once grouping those actions, perform the same activity for the second category: out-of-learning-behavior. These are actions that occur before and after a learner participates in the course. These behaviors can include assessment performance, product/program purchasing, and other company interactions like marketing campaigns.
The goal of this exercise is to identify behaviors that tie back to your business objectives.
Secret #3: Get the Data
It’s the time you have all been waiting for: it’s time to get the data.
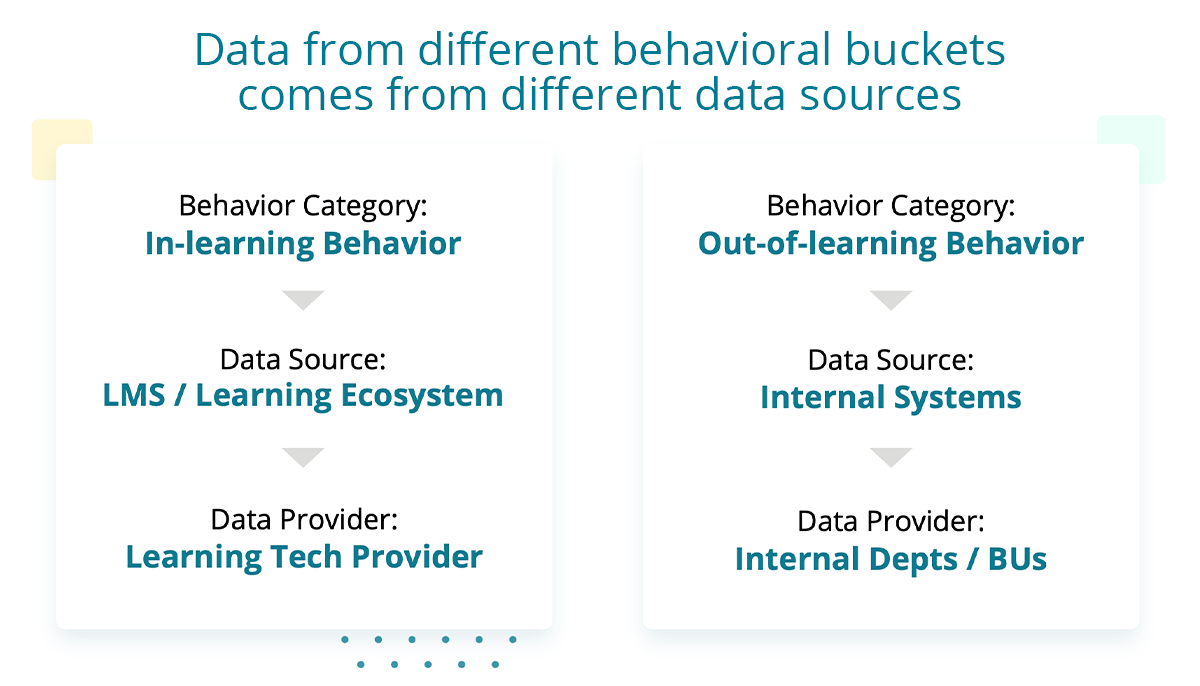
To make sure we are tying back data to our business objectives, you need to start with understanding how data correlates with categorizing behaviors into “in-learning” and “out-of-learning” buckets. Separating these behaviors into specific categories allows data collection to be much easier. Each category has separate data sources and data providers.
The data you have access to will largely depend on your learner provider. If you already have a learning solution in place, you will want to understand what data you have access to. If you are in the process of purchasing a learning management solution, you will want to understand what data they’ll be able to provide to you before making a final decision. Here are some sample metrics for common in-learning behaviors:
Utilization
- Number of new course enrollments
- Avg number of lessons/ flashcards completed per user
Performance
- Lesson/flashcard confidence levels
- Practice exam scores
Satisfaction
- Course reviews
- Net promoter scores
Retention
- Time on platform
- Average course progress 3/6/12 months from enrollment
Your learning tech providers are critical collaborators in providing you with the data you need, and learning platforms vary greatly in the quantity and quality of the data they produce.
What do I do now?
We started with “why” knowing that the best way to start is with the end goal in mind. Then we explored learners’ behaviors and grouped them into behavior buckets. Finally, we gathered in-learning and out-of-learning data with our learning tech provider. So, where do you go from here?
Watch our on-demand webinar to learn the final two storytelling secrets and how to put these steps together to turn these insights into action.